NOAA Releases Annual State of the Climate Report
NOAA has released its 28th annual State of the Climate report, and it highlights some troubling issues with our changing climate. 2017 was the third warmest year on record, with 2016 being the warmest and 2015 the second warmest. The top 10 warmest years have all occurred since 1997, but the real concern is the rate of recent warming. 2014 is the fourth warmest year at +1.8°F than average, but 2017, 2015, and 2016 were +1.98°F, +1.98°F, and +2.16°F respectively. 2017 and 2015 were virtually indistinguishable because the difference was less than one hundredth of a degree, which is less than the statistical margin of error.
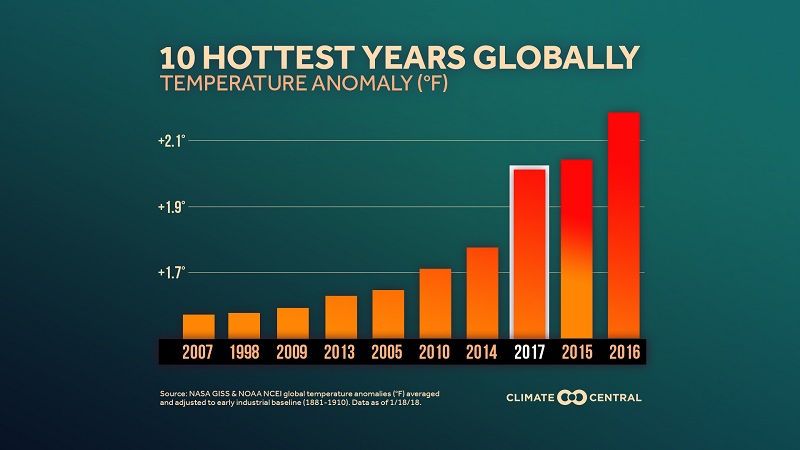
Graphic: Top 10 hottest years on record.
Credit: Climate Central
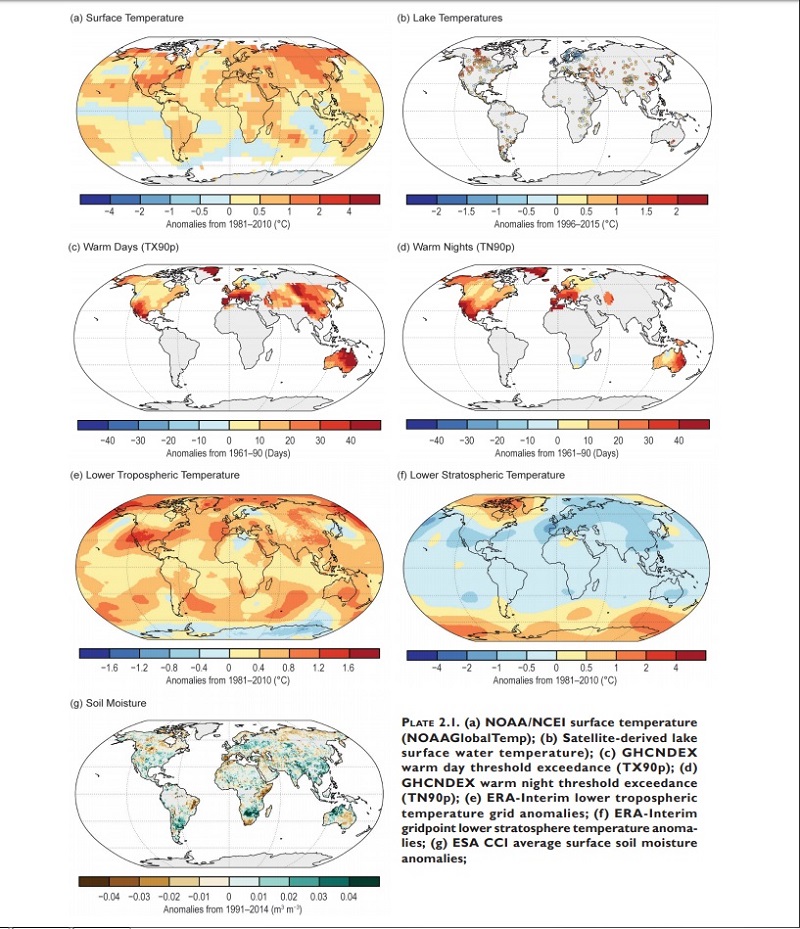
Figure: Global temperatures
Trending News
Credit: NOAA
Every year since 1990, hundreds of scientists from several countries offer insight on global climate indicators, extreme weather events, and other valuable environmental data in order to understand the global climate status and trajectory. This year’s contributions from more than 500 scientists from 65 countries take a look at 2017 and recent trends in order to determine the intricacies of environmental responses. This report is a culmination of global research that is gathered every year in order to determine the consensus of overall climatology, meteorology, oceanography, geology, ecology, biology, geophysics, earth science, hydrology, limnology, and atmospheric chemistry in regards to the state and forecast of the climate.
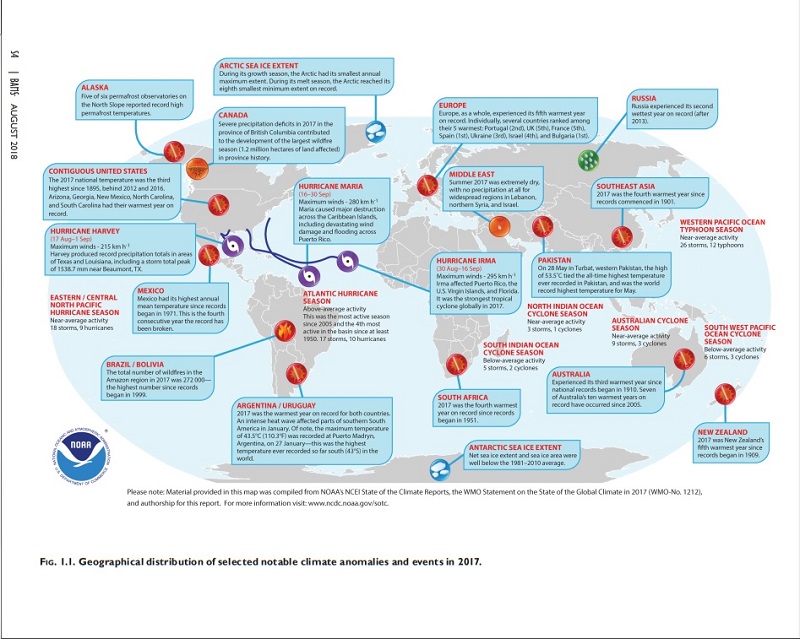
Figure: Spatial distribution of climate & weather events in 2017.
Credit: NOAA
Several unwanted records plagued the report. Major greenhouse gas concentrations in the atmosphere (Carbon dioxide, methane, nitrous oxide) reached record highs. The average global carbon dioxide concentration was the highest ever measured in the modern 38 year global climate period and records created from ice-core samples dating back as far as 800,000 years. Sea level rise hit an all new high of about 3 inches higher than the 1993 average. Global sea level is rising at an average rate of 1.2 inches per decade. Heat in the upper ocean level hit a record high, reflecting the continued accumulation of thermal energy in the uppermost 2,300 feet in the world’s oceans. Arctic maximum sea ice coverage fell to a record low. The 2017 maximum extent of Arctic sea ice was the lowest in the 38-year period. The September 2017 sea ice minimum was the eight lowest on record, 25% smaller than the long-term average. The Antarctic also saw record-low sea ice coverage, which remained well below the 1981-2010 average. On March 1, 2017, the sea ice extent fell to 811,000 square miles, the lowest observed daily value in the continuous satellite record that began in 1978.
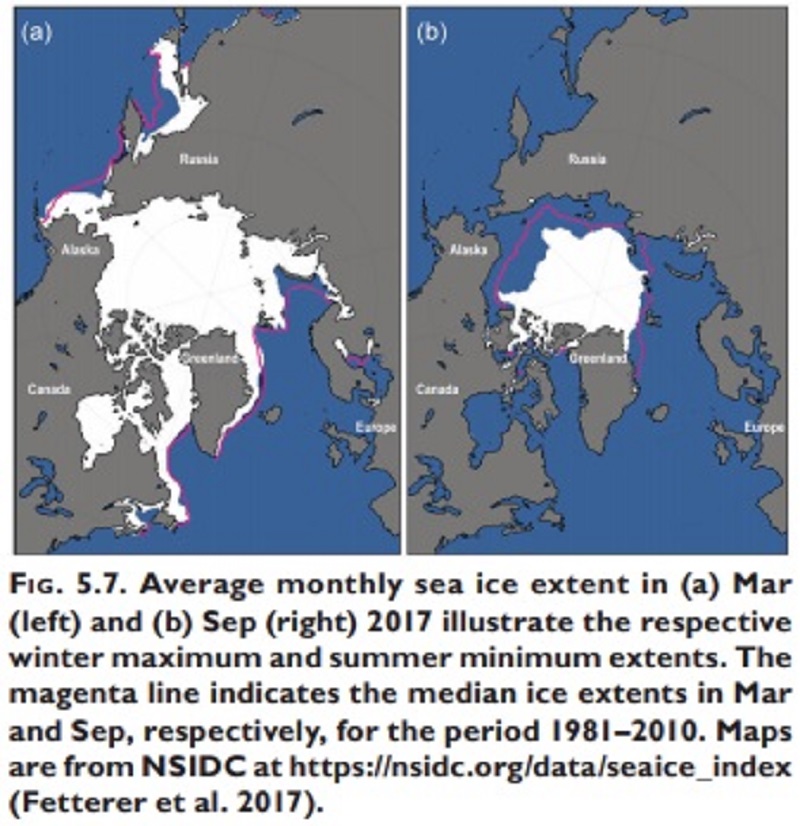
Figure: Average monthly sea ice extent in 2017 over the Arctic, with Magenta line representing 1981-2010 average.
Credit: NOAA
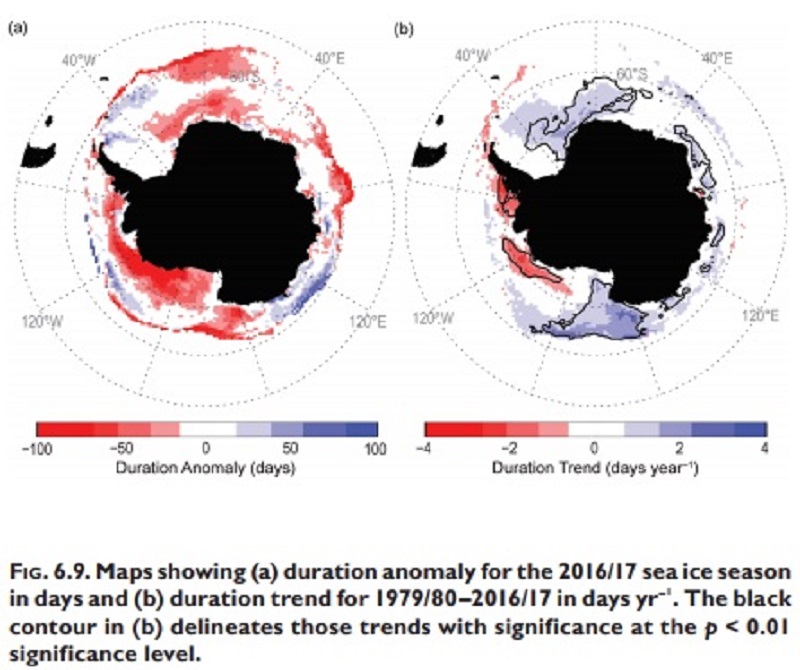
Figure: Change in sea ice season over the Antarctic.
Credit: NOAA
Breaking records help bring to light some key issues regarding climate, but it’s in the trends that allow hints towards the ability for proactive action. Global land and ocean combined surface temperature reached a near-record high. Depending on the dataset, average global surface temperatures were 0.68°F - 0.86°F above the 1981-2010 average. This marks 2017 as having the second or third warmest annual global temperature since records began in the mid- to late 1800s. Sea surface temperatures hit a near-record high. Even with the global average sea surface temperature in 2017 was slightly below the 2016 value, the long-term trend remained upward. The drought dipped and then rebounded. The global area of drought fell sharply in early 2017 before rising to above-average values later in the year. Unprecedented multiyear coral reef bleaching continued. A global coral bleaching event spanned from June 2014 through May 2017, resulting in unprecedented impacts on reefs. More than 95% of coral in some affected reef areas died. The total number of tropical cyclones were slightly above average overall. There were 85 named tropical cyclones in 2017, slightly above the 1981-2010 average of 82 storms.
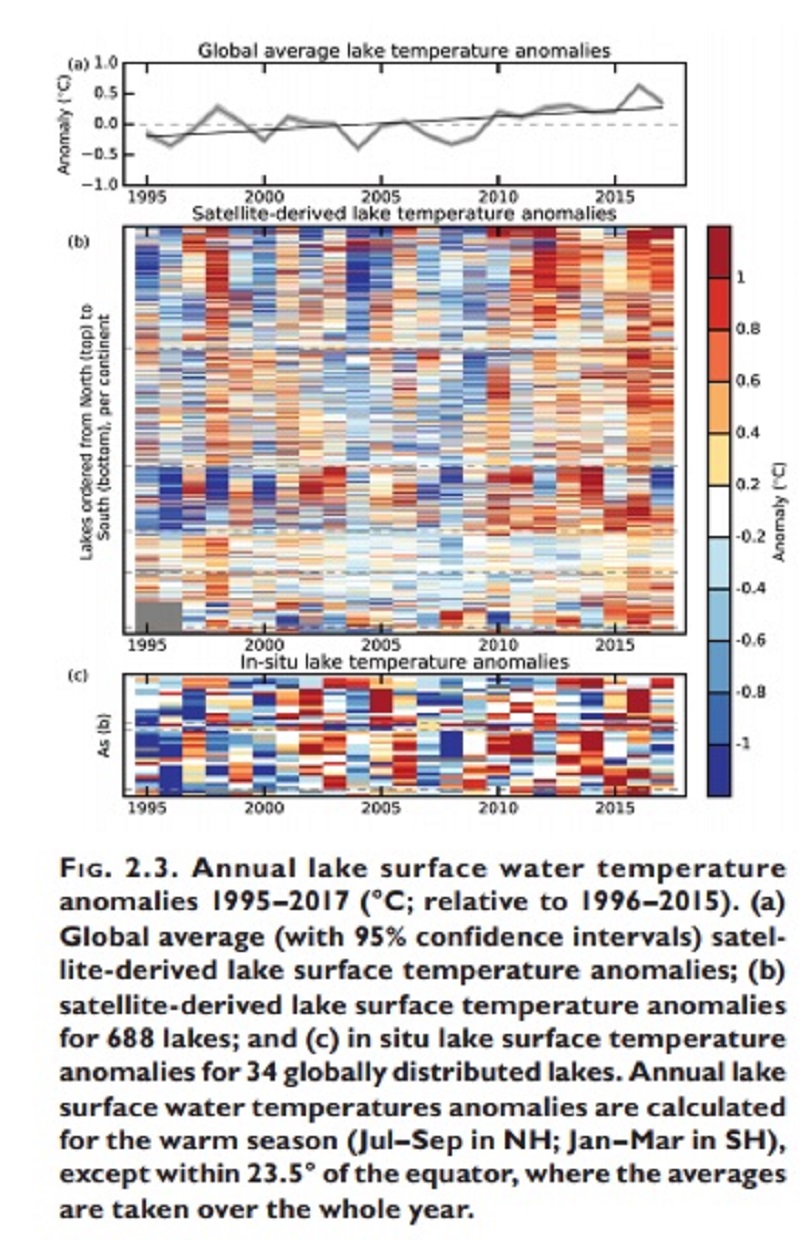
Figure: Below (blue) and Above (red) average annual lake surface temperatures from 1995-2017.
Credit: NOAA
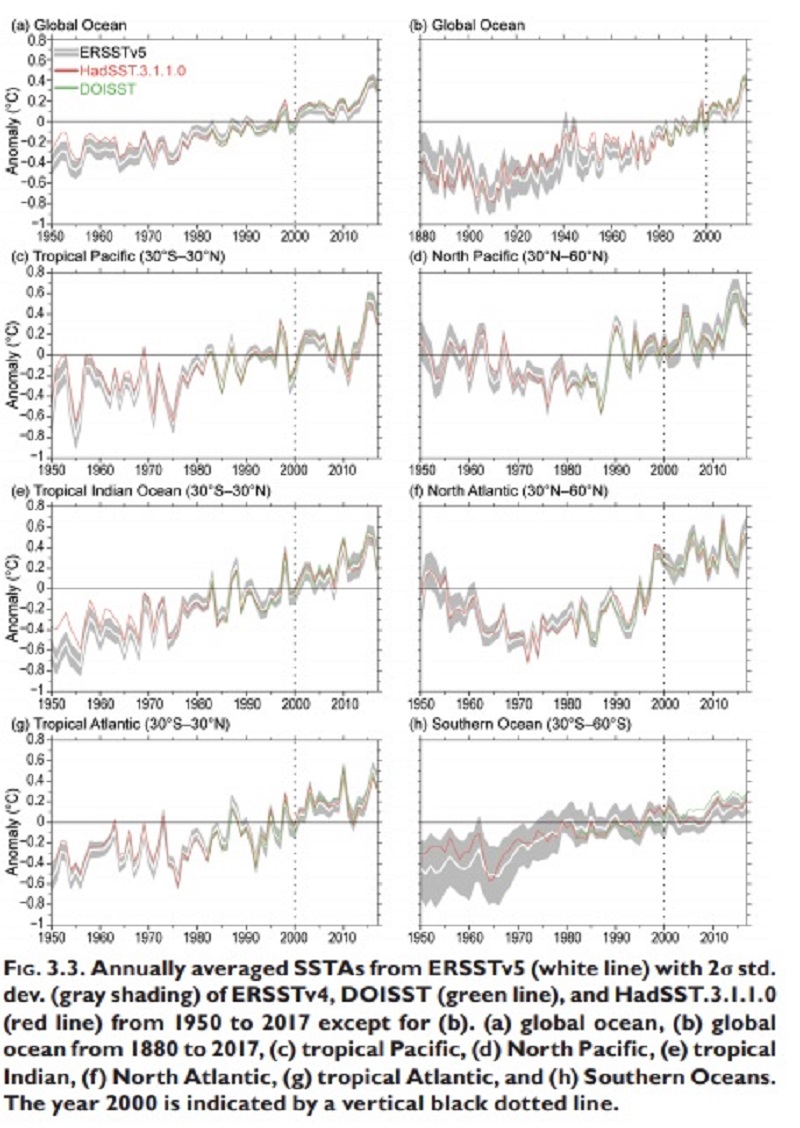
Figure: Annual sea surface temperatures by basin
Credit: NOAA
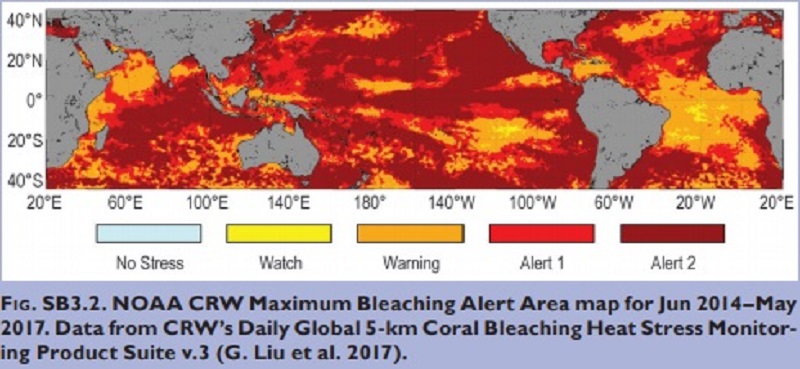
Figure: Bleaching alert map from June 2014 - May 2017.
Credit: NOAA
It is important to note that climate is a very intricate subject, one that can be impacted by several differing factors. It is only when we can observe the whole climate picture, can we begin to dissect the root and come up with solutions. It is clear that if we continue down this path, more records and streaks will keep getting broken. The thing to remember is that the data is numbers, but the results are not. These issues correlate to severe issues that can and eventually touch us all, potentially causing loss of life, property, and a changing landscape. We must work together and do what we can on both a global and regional scale, because every little change can lead to large, lasting affects.


